Observability just got a major upgrade.
You can now track every API request made to the Swarms API in one place. Search and filter by agent name or ID, monitor token usage and costs, and inspect complete request payloads and outputs.
Everything you need to understand, debug, and optimize your Swarms workflows is now at your fingertips, at cloud.swarms.world/history.
Every Request, In One Place
The execution history page reads your account's own request log. Every call your API key has made is there: single agents, multi-agent swarms, graph workflows, batched grids, auto agent builder runs. One row per completion.
A row tells you whether the run succeeded, which agent or endpoint served it, the task it was given, how many tokens it moved, what it cost, and when it happened. Sort by any of those. Tokens descending finds the expensive runs. Cost descending finds the ones worth looking at first.
Search covers more than the name. Type into the search box and it matches on agent name, endpoint, request ID, timestamp, and task text, and then keeps going into the raw log body itself. A string that appeared anywhere in a request or its response will find the run that carried it, which is usually how you locate the one call that went wrong.
Date filters scope everything. Last 24 hours, last 7 days, last 30 days, or a custom range with a start and end date. The count in the header updates as you filter, so you can always see how much of your history you are currently looking at.
Every Completion Has Its Own Page
This is the part that changes how the page is used. Clicking a row no longer expands it in place. It opens that completion on a page of its own.
That means every run in your account now has a URL. You can link to a specific failed call in a bug report, bookmark a run you are comparing against, open three of them in three tabs, or send a teammate the exact completion you are asking about instead of describing how to find it.
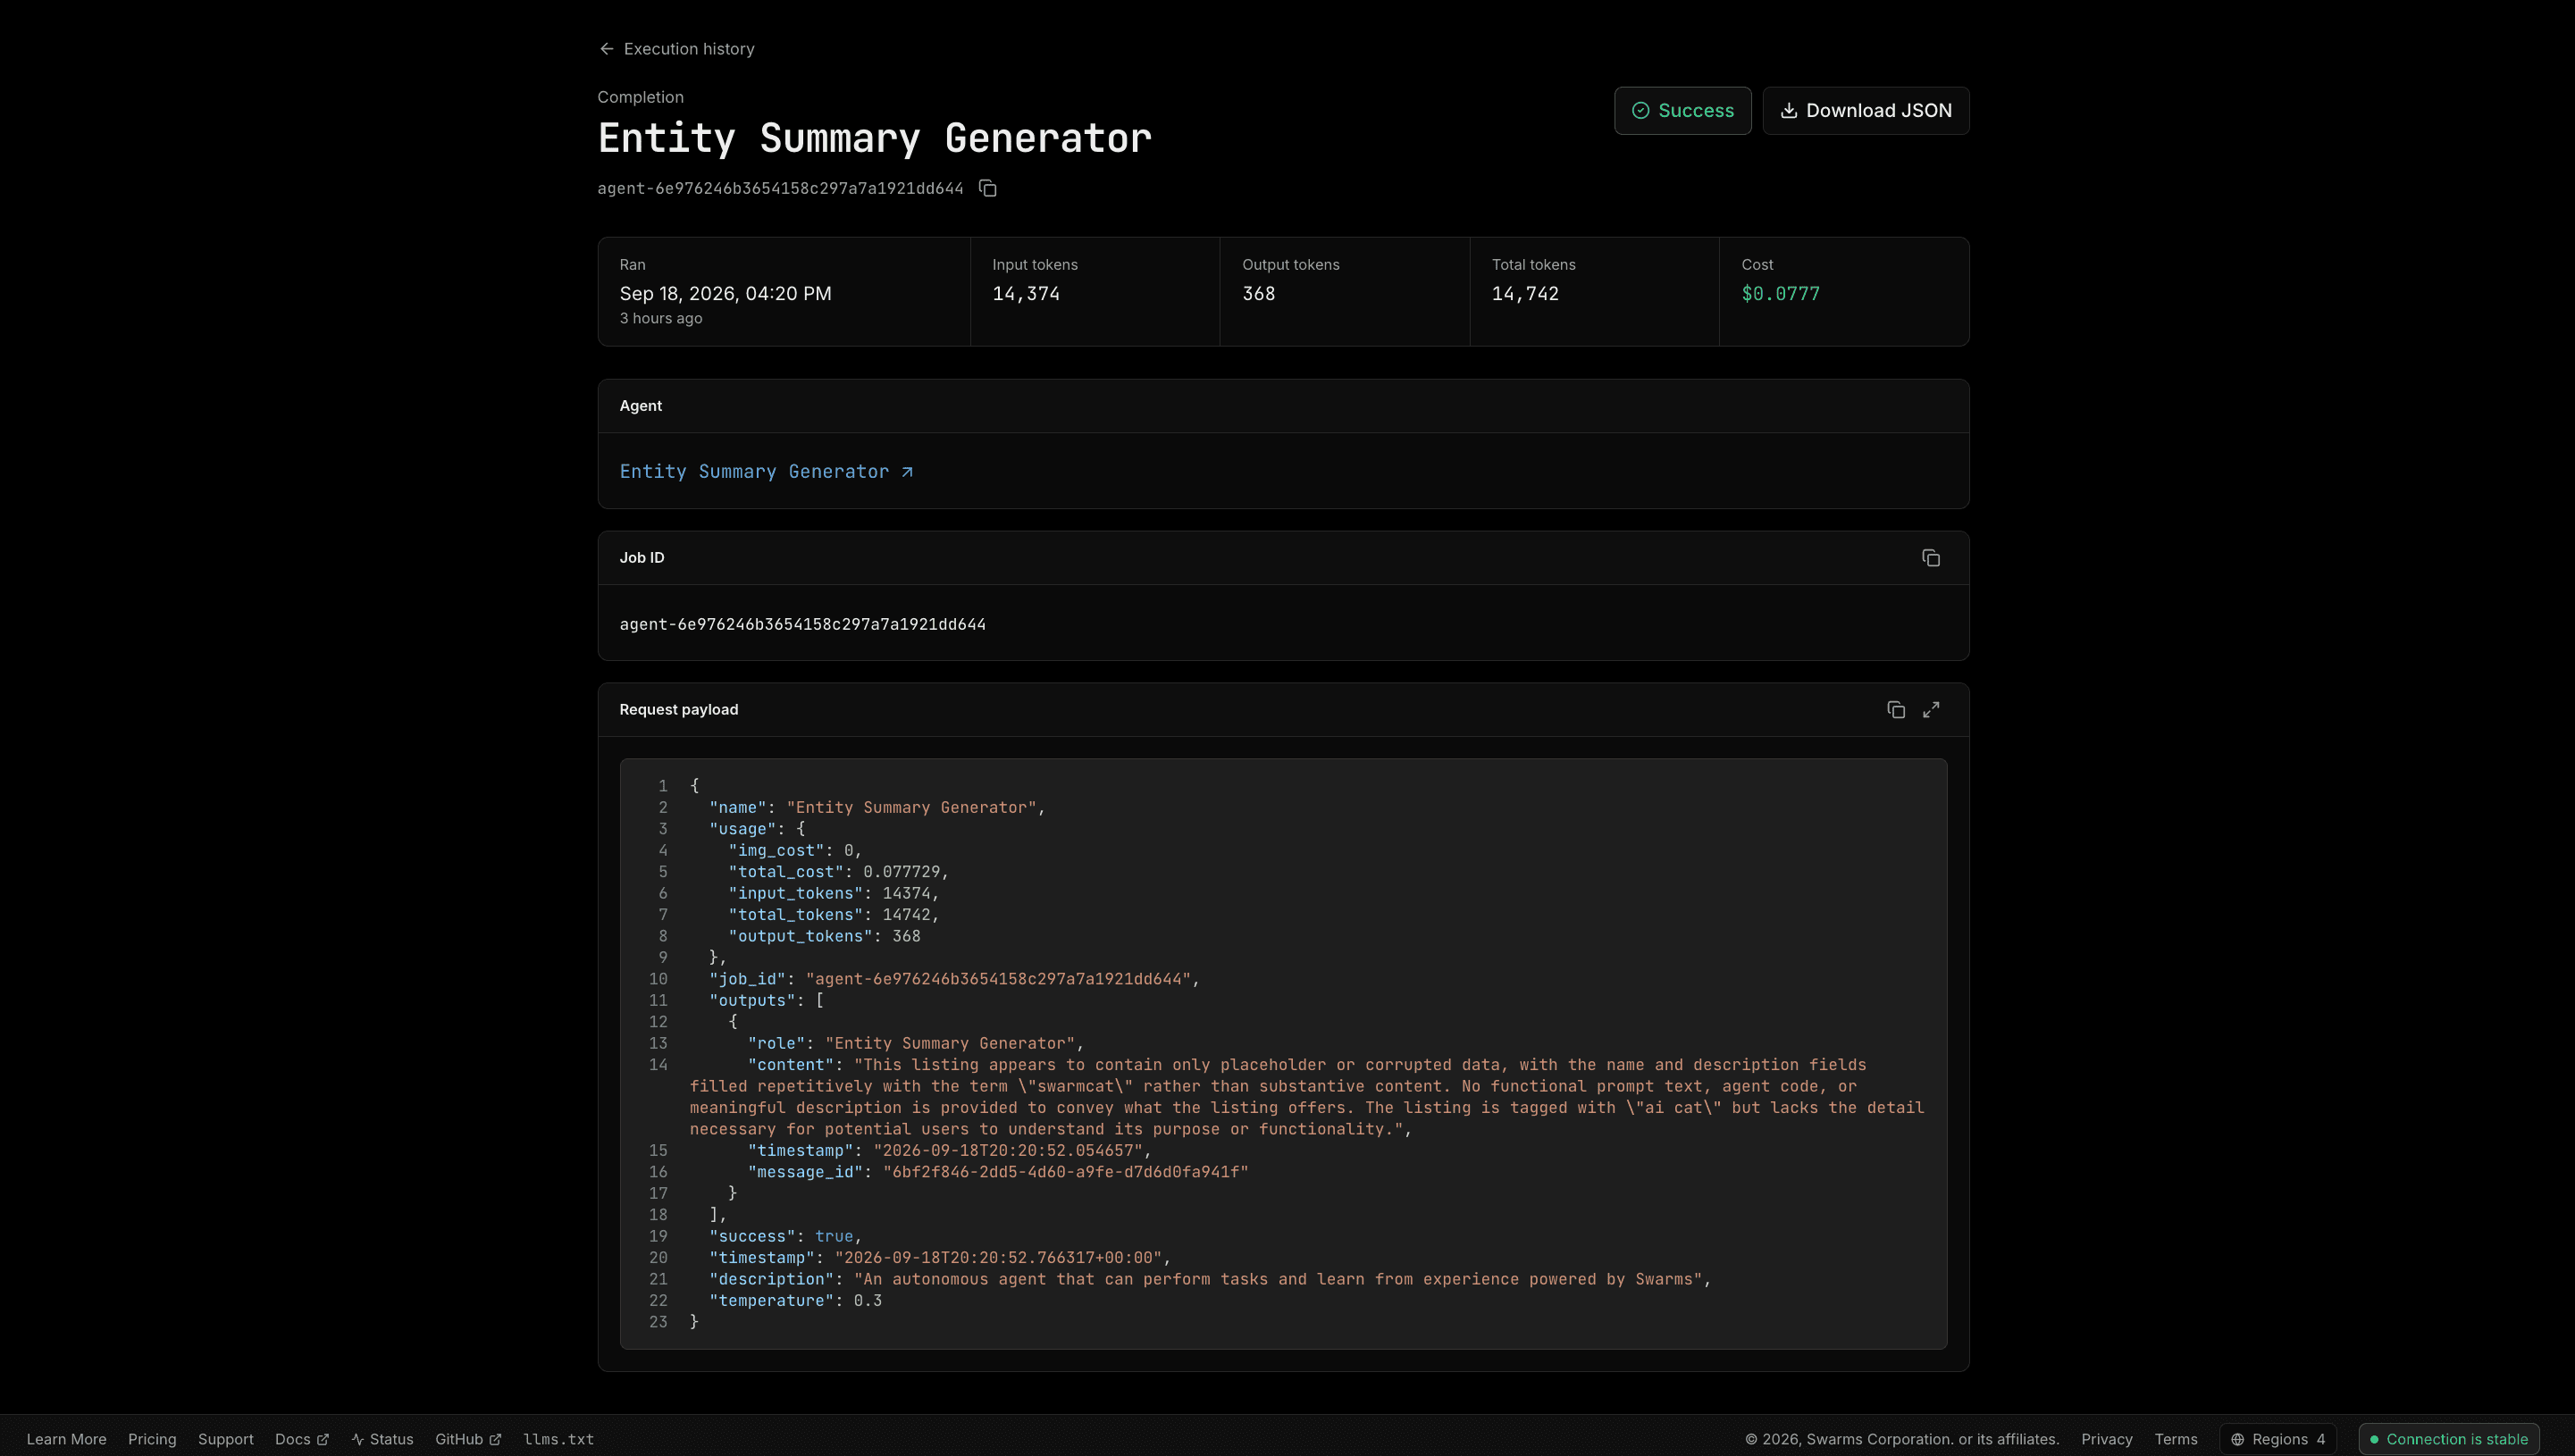
The page opens with what identifies the run: the agent it ran as, the completion ID with a copy button, and whether it succeeded or failed. Below that is a row of numbers for the run itself, when it happened, tokens in, tokens out, tokens total, and cost.
Then two things the list view could never show you well:
The agent, linked. The agent name on a completion page links straight to that agent's own page, where its system prompt, its full configuration, and its cost across every run are waiting. Going from one suspicious run to the configuration that produced it is now one click.
The job ID. Pulled out of the request payload and given its own row with a copy button, because when you are corresponding with support or correlating against your own logs, that is the identifier that matters.
The Request And The Response, In Full
Underneath is the part that makes a completion page worth opening: the exact request payload that was posted, and the exact response that came back, both as formatted JSON.
Not a summary of them. The actual objects, with every field the API received and returned. If an agent behaved in a way you did not expect, the answer is almost always in there: a system prompt that was not what you thought it was, a temperature left at a default, a model name that silently fell back, a tool definition that never made it into the call.
Both panels show generously on the page, and either can be expanded to a full screen view for a long payload. Long values wrap rather than disappearing off the right edge, so a prompt of several thousand characters is readable rather than something you scroll sideways through.
And there is a Download JSON button in the header of every completion page. One click saves the entire log entry, request and response together, as a .json file named after the completion. Attach it to an issue, diff two runs against each other, or feed it to whatever you use for analysis.
Costs That Are Actually Right
One detail worth calling out, because it was quietly wrong before and is now correct everywhere.
The Swarms API reports the charge for a run under a different key depending on which endpoint produced it. Agent completions publish total_cost. Graph workflows, batched grid workflows, and the auto agent builder publish token_cost. Swarm completions nest it under billing_info. Reading only the first of those, which is the obvious thing to do, reports $0.00 for most run types.
Every cost figure on the history page, on completion pages, and in the CSV export now goes through one shared definition that knows all three. The totals you see are the totals you are paying.
Take It With You
The filtered log exports to CSV. Whatever search and date range you currently have applied is what lands in the file: timestamp, agent name, endpoint, ID, status, task, input tokens, output tokens, total tokens, and cost per run.
That covers the reporting that a browser is the wrong tool for. Monthly cost per agent, token growth over a quarter, success rate by endpoint. Export the range and pivot it wherever you normally work.
Where To Find It
Open cloud.swarms.world/history. Everything on it is read from your own account through /v1/account/logs, so there is nothing to enable, instrument, or configure first. Your history is already there, including the runs you made before this shipped.
If you have never looked at it, sort by cost descending and open the top row. Most accounts find something surprising in the first thirty seconds.